Sea Level Rise
Uncertainty
The United Nations sponsored Intergovernmental Panel on Climate Change (IPCC) Fourth Assessment Report (AR4) Summary for Policy Makers (SPM) was recently published in February, 2007.� This report represents the consensus opinion of the scientific community and it has been endorsed by governments and industry.
 The Earth has warmed about 1.2 degrees
Fahrenheit over the last 40 years and 1.6 degrees F over the last century. �Figure 2 appeared in an article by climate
scientist Kerry Emanuel
summarizing the AR-4 findings.� The
warming is caused by human activities.�
In fact, from the figure, it appears that natural forcing functions
would have slightly cooled the planet over the last 60 years.� This much is not controversial.
The Earth has warmed about 1.2 degrees
Fahrenheit over the last 40 years and 1.6 degrees F over the last century. �Figure 2 appeared in an article by climate
scientist Kerry Emanuel
summarizing the AR-4 findings.� The
warming is caused by human activities.�
In fact, from the figure, it appears that natural forcing functions
would have slightly cooled the planet over the last 60 years.� This much is not controversial.
 Estimates of future warming assume an
equilibrium climate sensitivity between 1.5 and 6.2 degrees Celsius (5 to 95%
likelihood range) following a doubling of atmospheric CO2 (equivalent) concentrations.� A value of 3 degrees best fits the data.
These estimates have been around for decades and continue to receive support in
the scientific literature.�
Estimates of future warming assume an
equilibrium climate sensitivity between 1.5 and 6.2 degrees Celsius (5 to 95%
likelihood range) following a doubling of atmospheric CO2 (equivalent) concentrations.� A value of 3 degrees best fits the data.
These estimates have been around for decades and continue to receive support in
the scientific literature.�
A new paper by Dana Royer, Robert Brener and Jeffery Park, in fact, in the 29 March, 2007 issue of Nature concludes that �a climate sensitivity greater than 1.5 degrees C has probably been a robust feature of the Earth�s climate system over the past 420 million years, regardless of temporal scaling.�� This would seem to be the nail in the global warming skeptic�s coffin.� We know exactly how much carbon we are emitting each year into the atmosphere, about 7.5 Gtons currently.� And we know how much of it remains there, so it is a relatively mature scientific exercise to estimate a range for global warming based on emissions scenarios or models.�
Furthermore, AR4 projects, based on these emissions scenarios, that the likely range of temperature increase extends to 11.5 degrees Fahrenheit by 2100.� This finding is also non-controversial.� The second volume of the AR4 report, to be released April 6, will detail the expected effects of anthropogenic global warming for each degree Celsius rise in temperature.� Again, there does not appear to be much controversy in the scientific literature surrounding these projections. �The only uncertainties, as to the extent of the global warming impact, relate to the various emissions scenarios, i.e., human behavior, our response to the warnings of scientists and the limits of fossil fuels. �
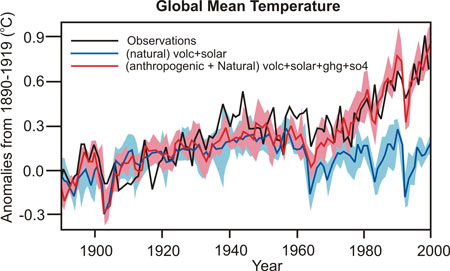
Figure 2����������� Observed global mean temperature over the last century compared to models used to predict future temperature rise.
 A CNN
report quotes Harvard University oceanographer James McCarthy, who was a top
author of the 2001 version of this report, "the worst stuff is not going
to happen because we can't be that stupid. Not that I think the projections
aren't that good, but because we can't be that stupid."� So just how stupid we are remains the
biggest uncertainty with respect to climate change.
A CNN
report quotes Harvard University oceanographer James McCarthy, who was a top
author of the 2001 version of this report, "the worst stuff is not going
to happen because we can't be that stupid. Not that I think the projections
aren't that good, but because we can't be that stupid."� So just how stupid we are remains the
biggest uncertainty with respect to climate change.
 The AR4 SPM however is not without some
controversy.� The range of sea level
rise is reported to extend from 7 to 23 inches during the coming century.� This is devastating enough to be sure,
however there is controversy and uncertainty pertaining to the upper
limit.� Recent sea level rise is known
with great accuracy.� The impact of
projected global warming on non-polar glaciers and thermal expansion of the
oceans is also well understood.� But the
AR4 projections specifically exclude contributions from possible rapidly
changing flow from Greenland and Antarctic ice sheets.� These are excluded, according to
climatologist Stephan Rahmstorf, because they are not well understood.� One of the most famous glacier scientists,
about whom Mark Bowen wrote the book �Thin Ice�, Ohio State University
professor Lonnie Thompson, said they "don't take into account the gorillas
� Greenland and Antarctica.� I think
there are unpleasant surprises as we move into the 21st century."�
The AR4 SPM however is not without some
controversy.� The range of sea level
rise is reported to extend from 7 to 23 inches during the coming century.� This is devastating enough to be sure,
however there is controversy and uncertainty pertaining to the upper
limit.� Recent sea level rise is known
with great accuracy.� The impact of
projected global warming on non-polar glaciers and thermal expansion of the
oceans is also well understood.� But the
AR4 projections specifically exclude contributions from possible rapidly
changing flow from Greenland and Antarctic ice sheets.� These are excluded, according to
climatologist Stephan Rahmstorf, because they are not well understood.� One of the most famous glacier scientists,
about whom Mark Bowen wrote the book �Thin Ice�, Ohio State University
professor Lonnie Thompson, said they "don't take into account the gorillas
� Greenland and Antarctica.� I think
there are unpleasant surprises as we move into the 21st century."�
The fact of the matter is recent measurements show that sea surface rise matches the worst case projection of the AR4 quite well, and exceeds the upper bound projections as shown in Figure 4.� This trend line extrapolates to 35 inches of sea level rise by the end of the century.
Why is it difficult to predict the contribution to sea level rise from these massive ice sheets and what does the most recent glacier science tell us?� Most of this science is unfortunately behind paywalls and most of my material is taken directly from that body of work.� However, a good summary by Stefan Rahmstorf, is available here.
Figure 4 Comparison of the 2001 IPCC sea-level scenarios and observed data.
Several factors determine the net rate of growth or decline of ice sheets. These are: accumulation of snow in the central parts, which adds mass and lowers sea level, sublimation which is the phase change from solid to gas or water vapor, melting of ice along the sheet's margins (runoff) and bottom, which decreases mass and raises sea level, and iceberg calving into the sea from outlet glaciers also along the sheet's edges, which also decreases mass and raises sea level.��
One might think that an ice sheet would be simpler to model than the coupled ocean-atmosphere climate system.� According to a Perspective article in Science by Vaughan and Arthern, 16 March 2007, �ice sheet are composed of a single, largely homogeneous material.� Their viscous flow is governed by the Navier-Stokes equation formulated in the mid-19th century.��� What turns out to be difficult is specifying the stress boundary conditions on two of the ice sheet interfaces: its base and its seaward margin.�
The importance and complexity of water flow beneath ice sheets is only now becoming apparent.� Helen Fricker, Ted Scambos, Robert Bindschadler and Laurie Padman describe satellite laser altimeter elevation profile observations from 2003 to 2006 which reveal a widespread, dynamic subglacial water system that may exert an important control on ice flow and mass balance.� Their paper �An active Subglacial Water System in West Antarctica Mapped from Space� was published in the 16 March, 2007, issue of Science and is only available to subscribers.� They conclude �The time scale for subglacier water transport (months to years) is short compared with that of other known drivers of glacial flow variability, suggesting a mechanism for more rapid changes in ice steam behavior than have previously been assumed.�� Water beneath the ice sheets acts as a lubricant increasing the rate of ice flows into the sea.� This effect is not accounted for in the AR4.��
Figure 3:�
Schematic drawing of glacial features illustrating how moulins transport
surface water to the base of the glacier from Wikipedia. Source:
NASA
A more serious situation exists in Greenland where meltwater has been observed to flood through moulins or crevasses to lubricate the base of the ice sheet.� This situation is shown in Figure 5.
According to a study by the Jet Propulsion Laboratory in 2006, in 1996 Greenland was losing about 19 cubic miles per year in mass from its ice sheet. In 2005, this had increased to about 44 cubic miles a year due to rapid thinning near its coasts, while in 2006 it was estimated at 48 cubic miles per year.� A study by Jianli Chen, Byron Wilson and Clark Tapley in Science, reports surface melting of Greenland's ice cap reached 57 cubic miles a year between April of 2002 and November of 2005.� This is reported here.
Wikipedia reports that Greenland contains about 10% of all the fresh water on the Earth and if the entire 2.85 million cubic km of ice were to melt, it would lead to a global sea level rise of 7.2 m (23.6 ft.). This would inundate most coastal cities in the world and remove several small island countries from the face of Earth, since island nations such as Tuvalu and Maldives have a maximum altitude below or just above this number.
According to another recent article in the journal Science, March 2, 2006 by Isabella Velicogna and John Wahr, Antarctica is losing ice mass at the rate of between 16 and 51 cubic miles a year averaging 37 cubic miles per year. �This is reported here. �Antarctica, according to the AR4 is projected to gain mass.
The Antarctic ice sheet contains about 87% of the fresh water on the Earth surface and if it melted would raise sea levels by 63 meters.
The latest measurements of Greenland and Antarctic ice sheets have been made using the latest gravity recovery and climate experiment (Grace) satellites.� These two satellites were launched in 2002 in order to measure small perturbations in gravity and hence variations in the total mass of the ice sheet.� They orbit the Earth separated by 137 miles. A change in gravity due to a change in thickness of the ice sheet below is detected by small changes in the distance between the satellites. Scientists can detect changes in distance between the Grace satellites equivalent to one fiftieth of the diameter of a human hair.
In conclusion, neither the Greenland nor Antarctic ice sheets have been projected to contribute to sea level rise during the next century according to the AR4.� However, recent measurements confirm that both ice sheets are shrinking at an accelerated pace.� Observations of sea level rise are already on the worst case trajectory which when extrapolated exceeds the highest level estimated in the AR4 by about 1 foot.
It is clear is that the physics controlling Greenland and Antarctic ice flow is not yet well understood and that the most recent data paints an increasingly pessimistic picture.�
It might be wise to put off any purchase of ocean-front property for the moment.
Tony Noerpel
April 4, 2007